Why different stocks behave differently in Ticker Panic
Learning a ticker should mean more than memorizing its name. Ticker Panic's stock-personality design connects normal movement, event reactions, volatility and liquidity. Selecting a different asset can change the kind of decision you are making.
Look beyond the direction of the line
Two charts can be rising for different reasons. One may react to a company development, another to broad enthusiasm, and a third may have little available depth behind its visible movement.
Inspect identity, events and position context together. Selected-stock information and Company Profile help preserve that context, rather than reducing a company to its last quoted price. The time range also matters: a short surge can look very different in the longer history.
Different captures, different trading problems
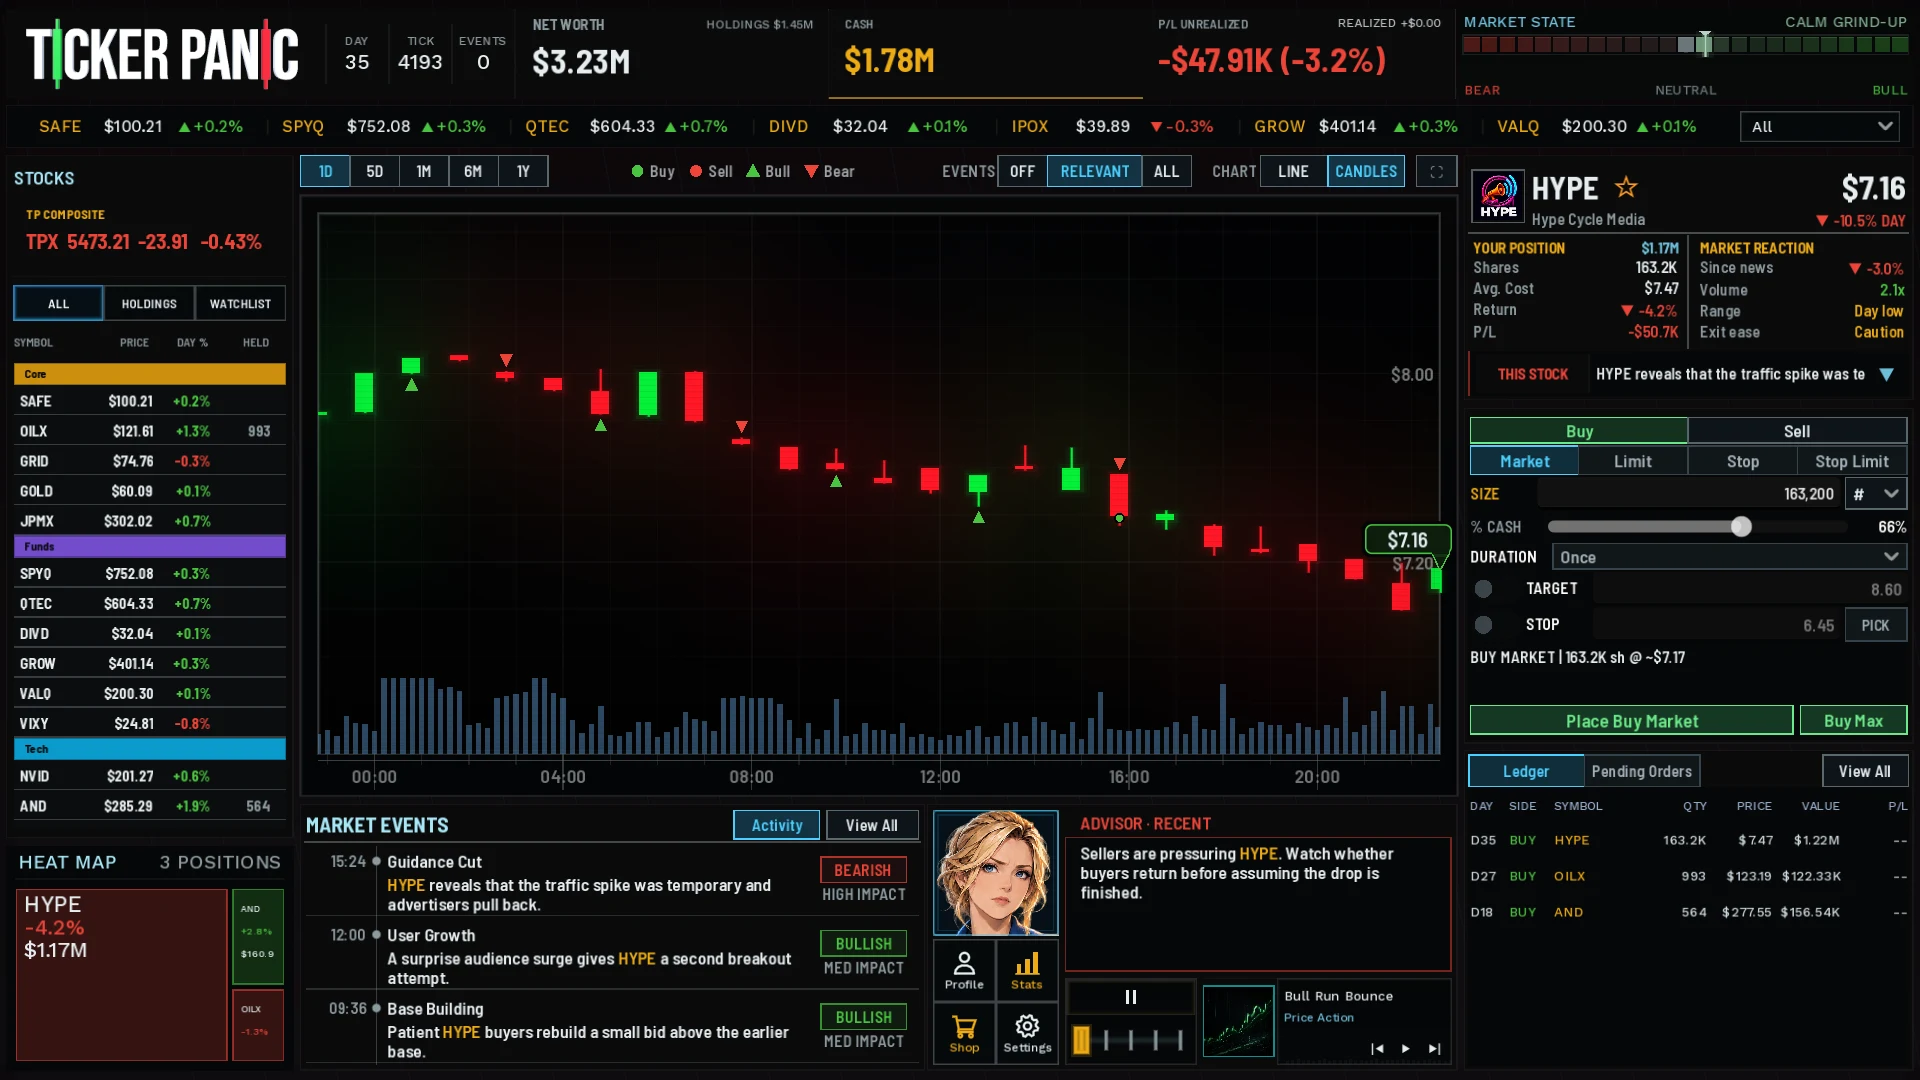
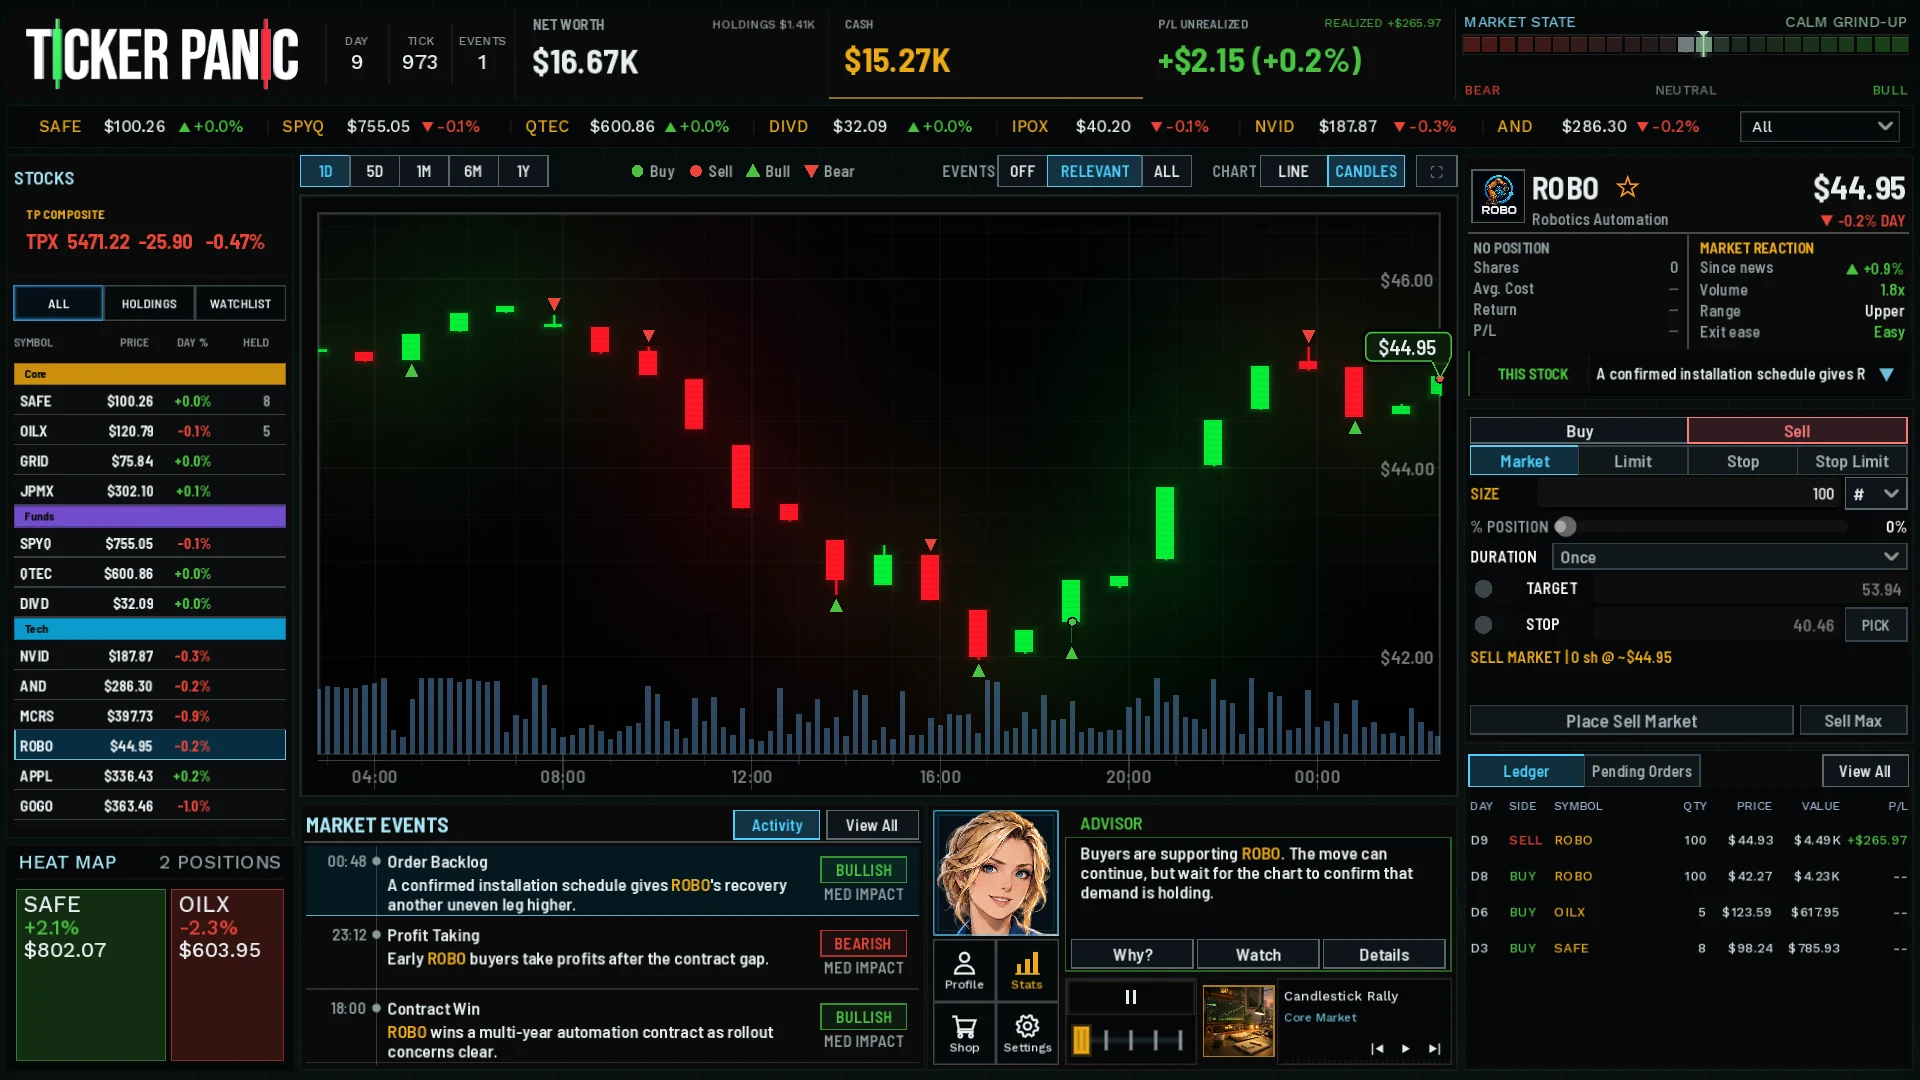
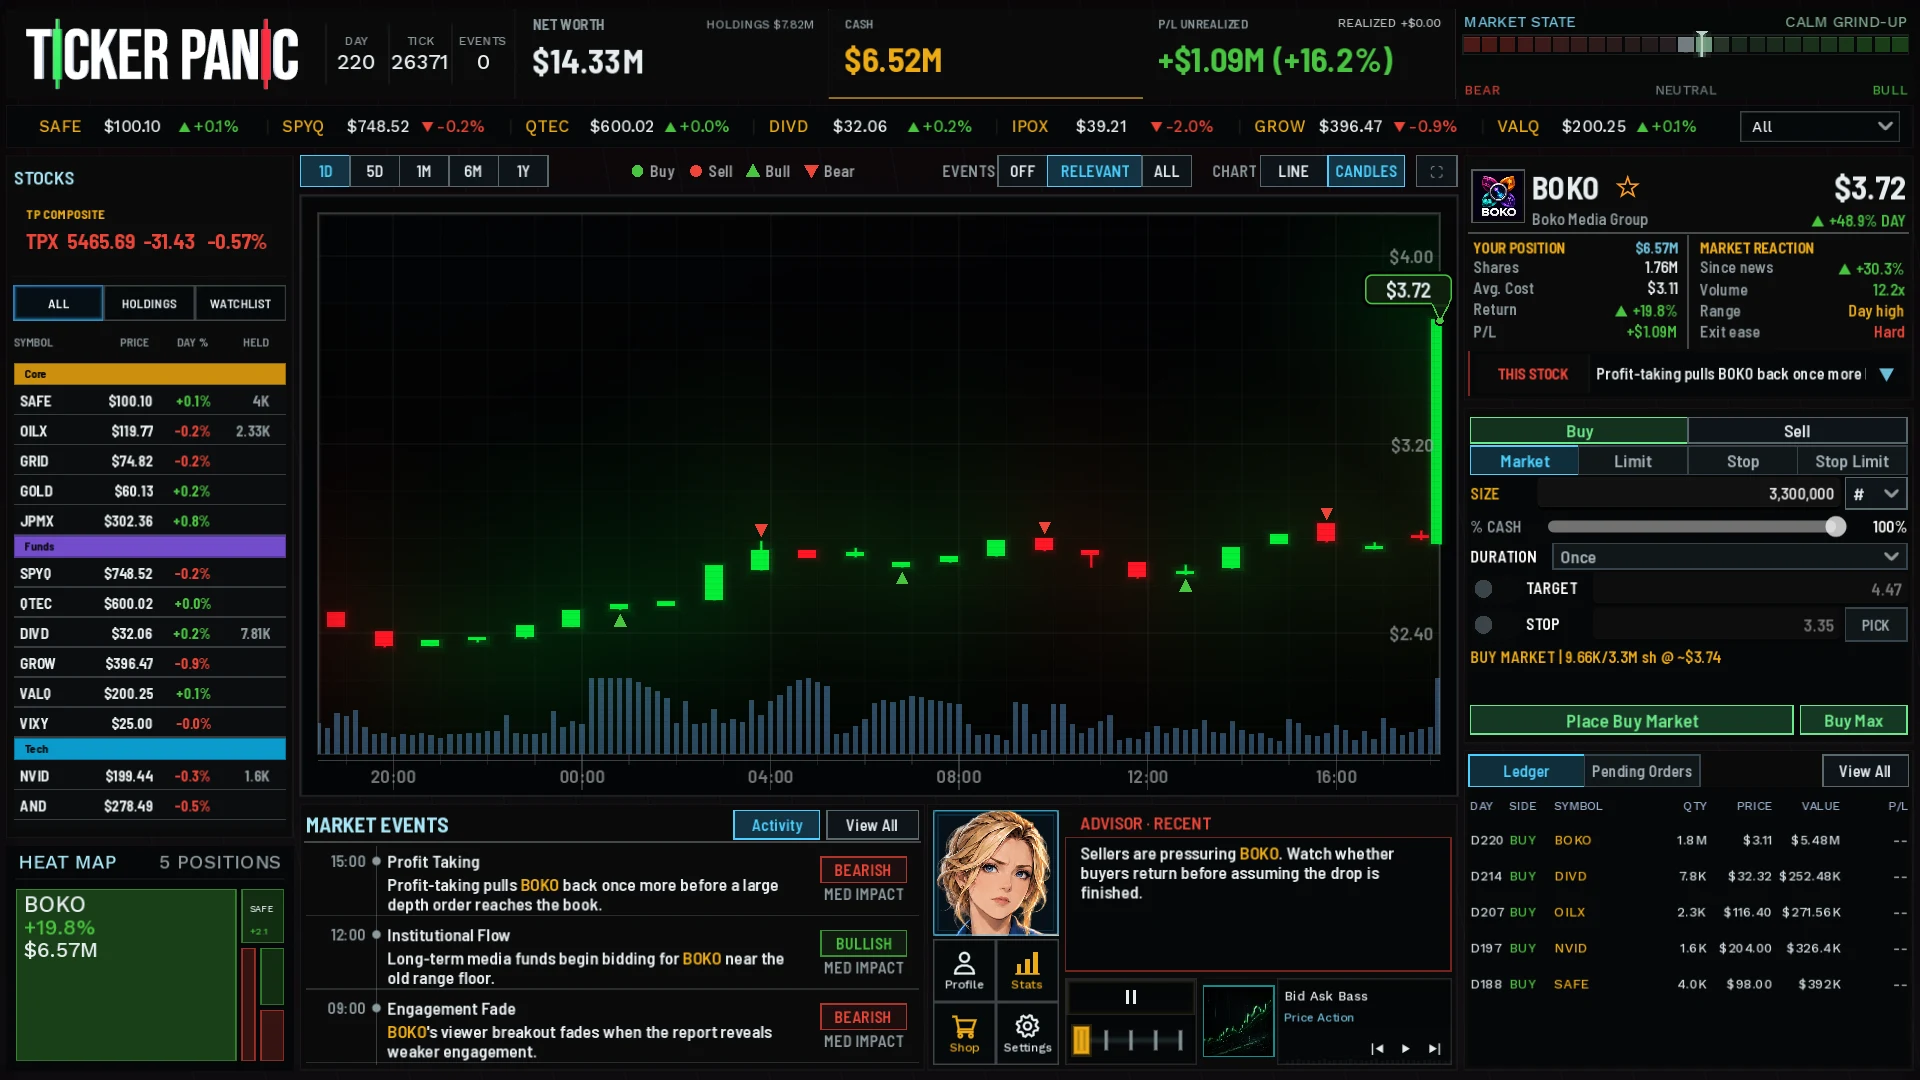
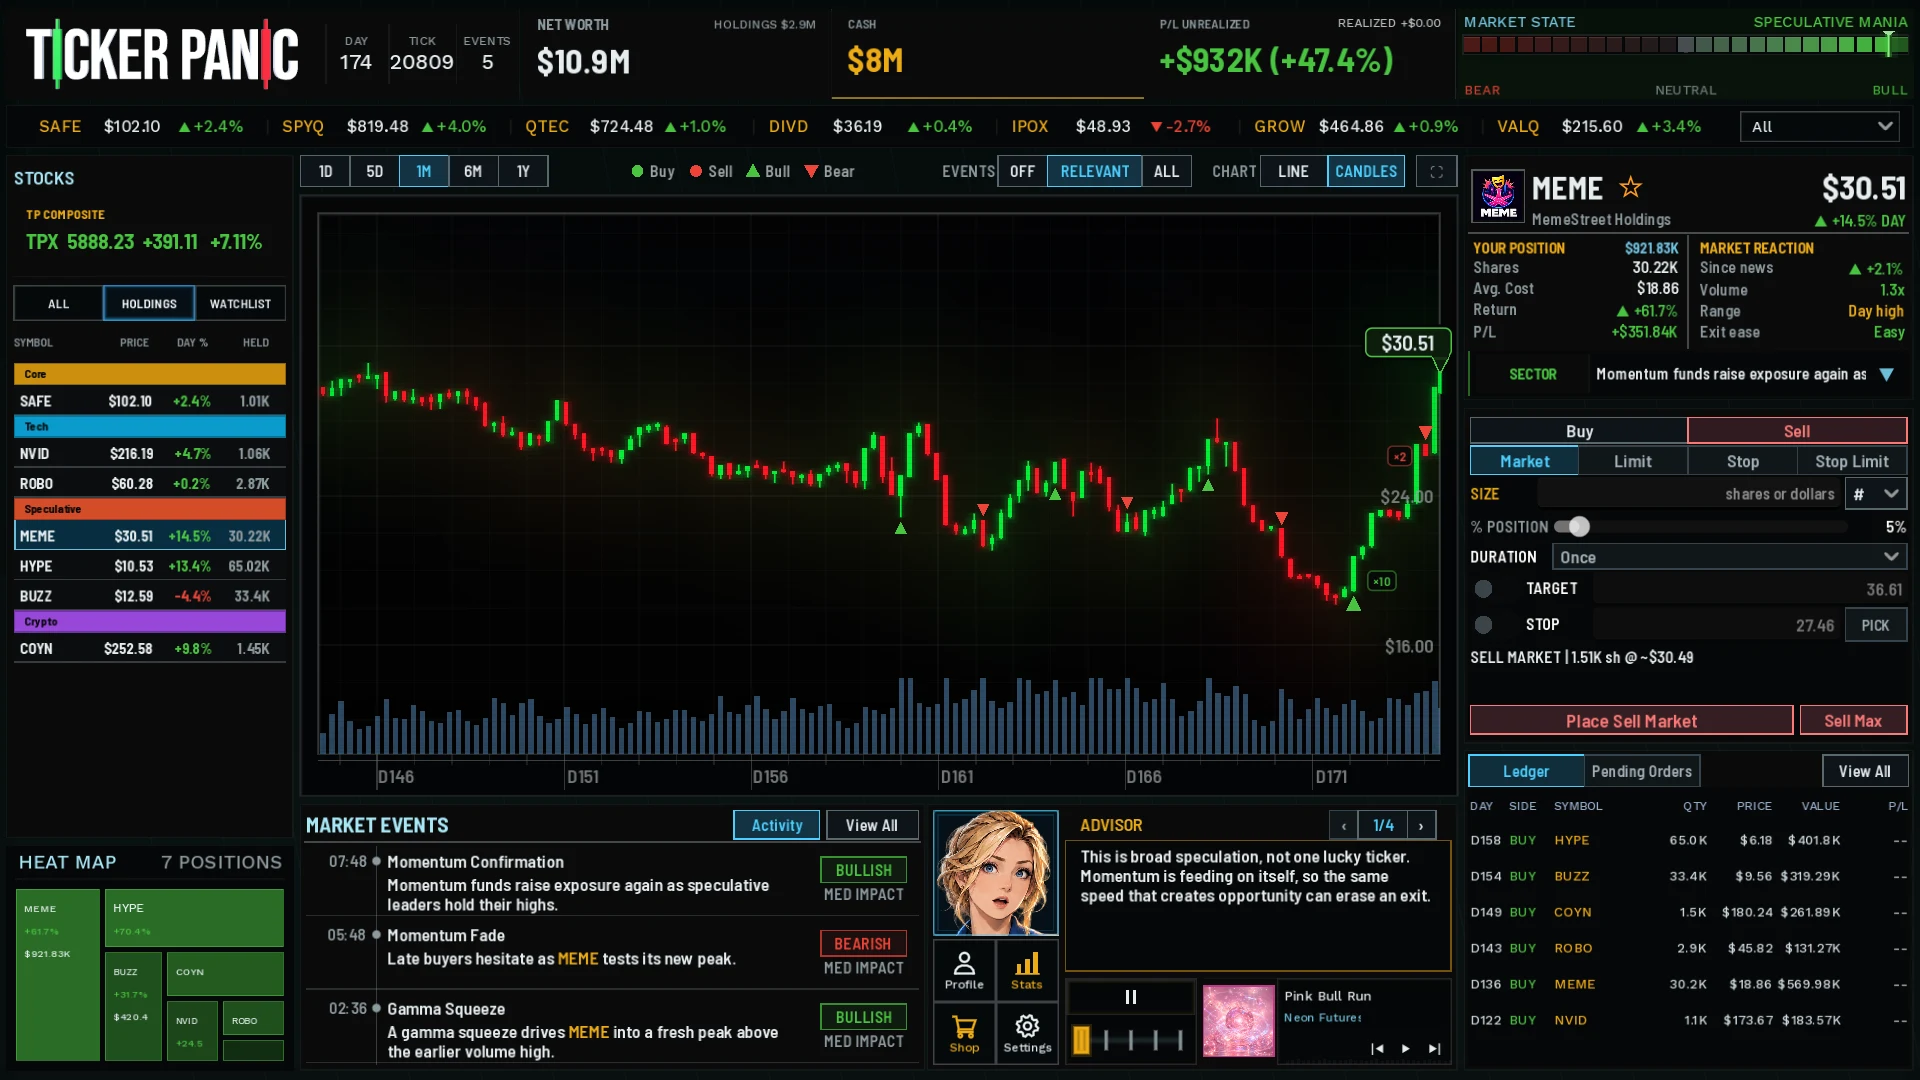
ROBO shows a small buy-and-sell sequence with a recovery. MEME shows a speculative rally across a larger portfolio. PINK shows an exit constrained by liquidity. These are different situations, not rules that one ticker always wins or loses.
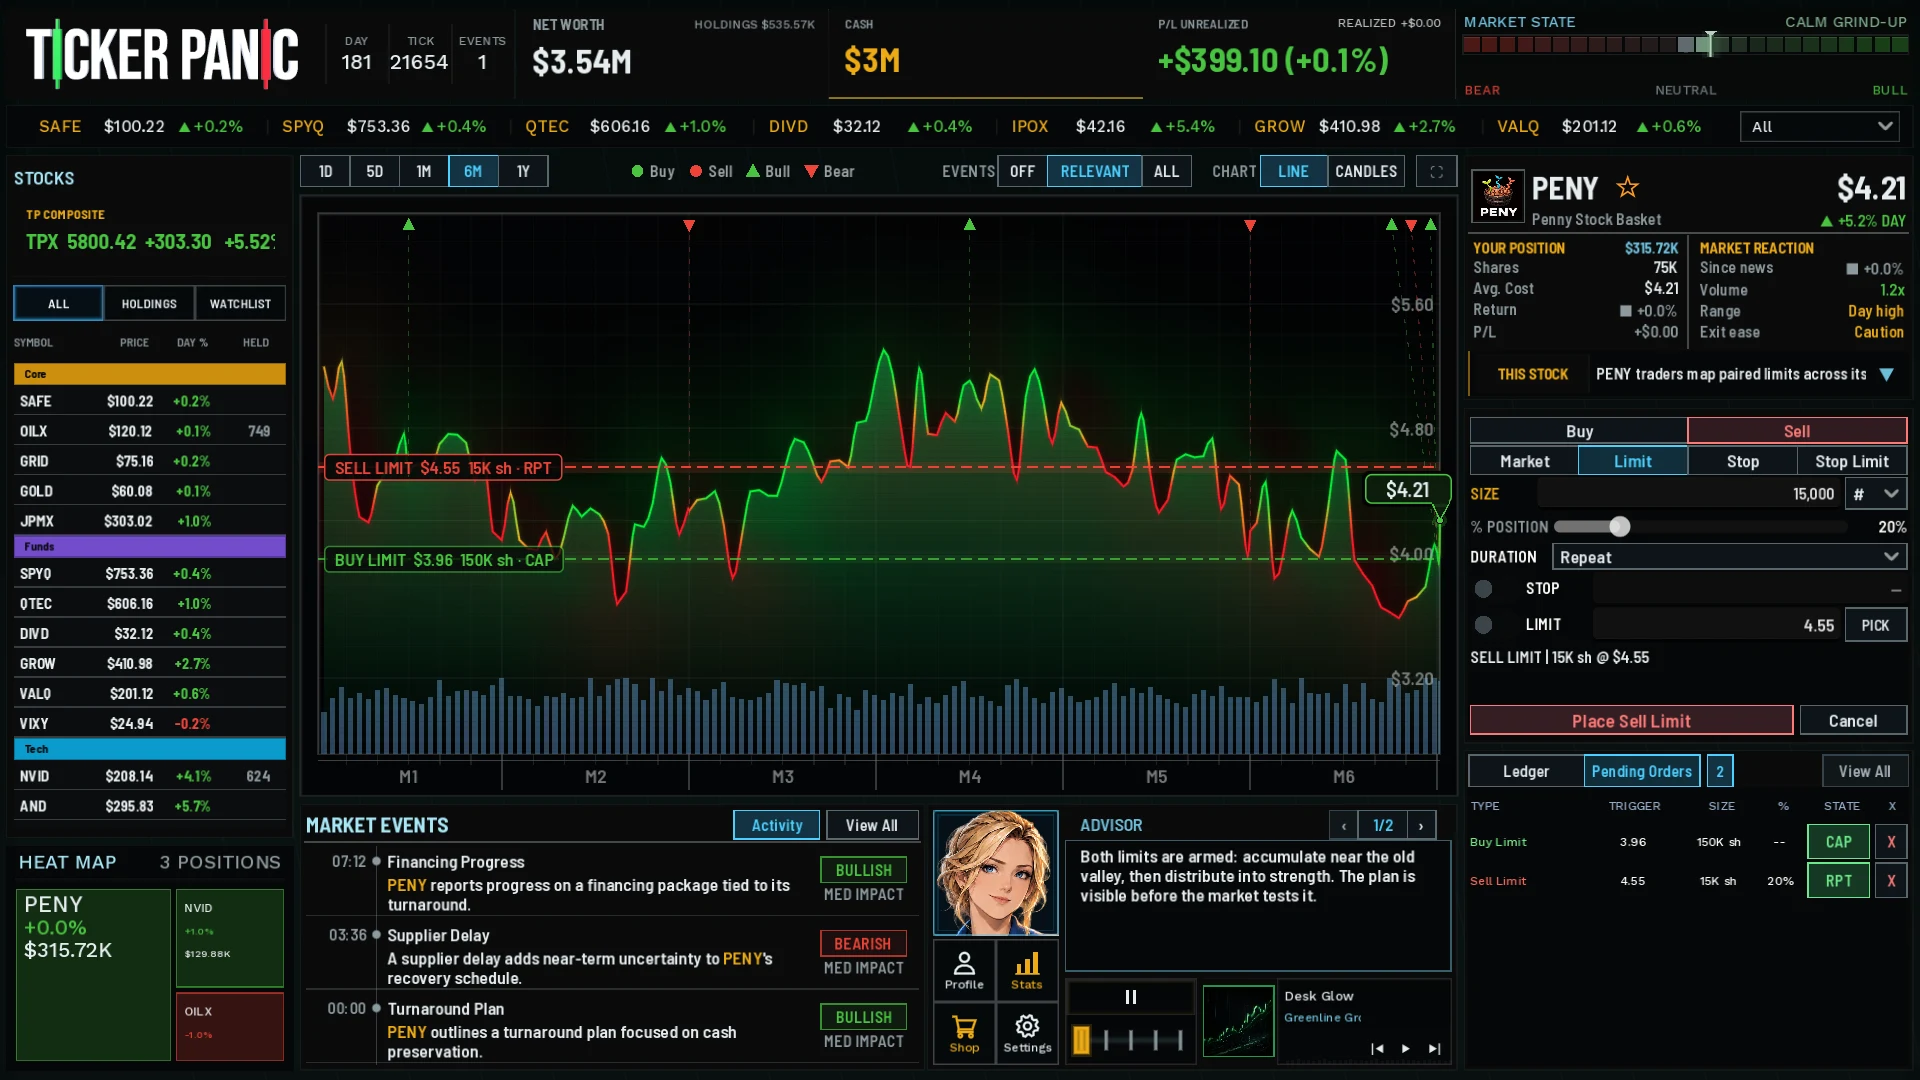
PENY's paired limits show another approach: express price conditions and watch whether they execute. The question becomes what the stock does around your intended entry and exit, not merely whether its daily movement is green.
One story need not affect every stock alike
The personality system connects event sensitivity with stock behavior. A company-specific story and a broad event need not produce the same response across the roster. That difference gives you a reason to compare assets instead of treating them as interchangeable lines.
Relevant chart events focus supported context for a selected stock. An unrelated event appearing in the all-events view is not evidence that it caused the movement you noticed.
Think in exposures, not ticker count
Several holdings can spread positions while still sharing sensitivities. Compare the heat map with market state and news instead of treating the number of holdings as a complete description of risk.
The roster and balance evolve during development. Use observed behavior and company information to form a view, then revisit it as conditions change. A familiar stock should help you ask better questions, rather than suggest a guaranteed outcome.